
This is a record of my time at Pt England School in Auckland, New Zealand.
Friday, 22 March 2019
Wednesday, 20 March 2019
Thursday, 14 March 2019
Friday, 8 March 2019
Wednesday, 6 March 2019
Viliami reading bar graph
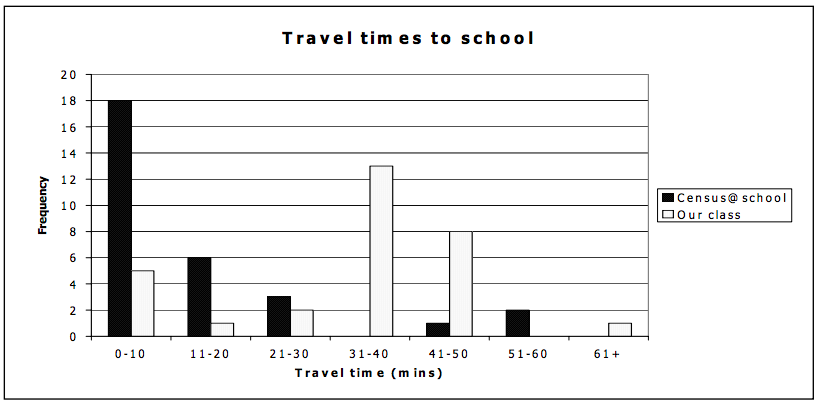
This is my groups answers
Seluone Dontae Viliami
Mrs Tele'a wants to read this graph correctly, what are some things she needs to understand to do this?
a. List: know what the axis are showing
b. Black represents NZ school kids, white represent a class
2. Why do you think this information was collected?
- People wanted to know how long children are spending travelling to school.
- Find out if travel time affects their school work
3. What questions would have been asked to find out this information?
- How long does it take you to travel to school
- How do you travel to school
4. What could this teach us about travel time for children in NZ?
- Some children are having to travel very far to get to school.
Monday, 4 March 2019
Subscribe to:
Posts (Atom)